I’m about to regulate Internet use
Based on this suggestion from Nicholas Taleb on edge.org
Based on this suggestion from Nicholas Taleb on edge.org

Every indicator against the SPX:
CONSUMER DEBT LEVEL
cuando el cambio % [año/año] mensual es negativo:
Hay mucho mas potencia de subida en el SP500, aunque esto solo ha pasado 20 veces, la p(win) de buy and hold es 90% a un time frame de 6 meses.Es normal ganarse 10% return en 6m cuando esto pasa. El cambio % tiene que ser menor que la mediana, pq de lo contrario nunca se ha visto algo así. Pilas cuando es una caida de entre 5% y –2%.
REUTERS COMMODITY RESEARCH BUREAU
cuando el cambio puntual [año/año] mensual > 100 no hay tanto potencial como cuando el cambio es negativo cien puntos.
cuando los commodities agarran mas de 140 puntos para arriba, hay que vender el SP500 a 6 meses. ganancia avg de 13% con “zeta” de 5.
VALUATION
no tienen constancia para caida. solo subida.
i like trading no more.
Me siento frustrado por mi nivel de ingresos. O es que ya me adapté a hacer lo que tanto quería en los ultimos semestres de la U.
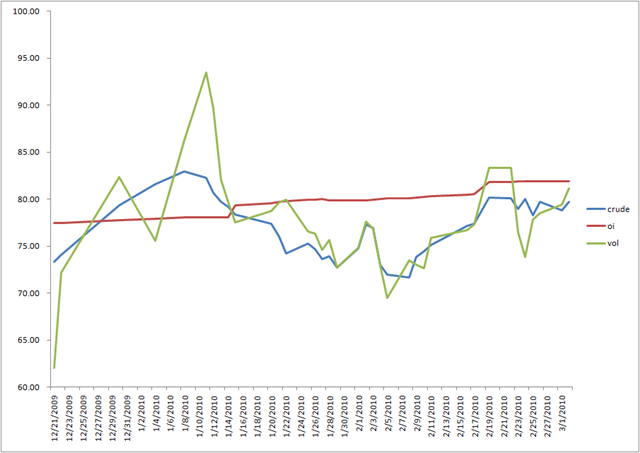
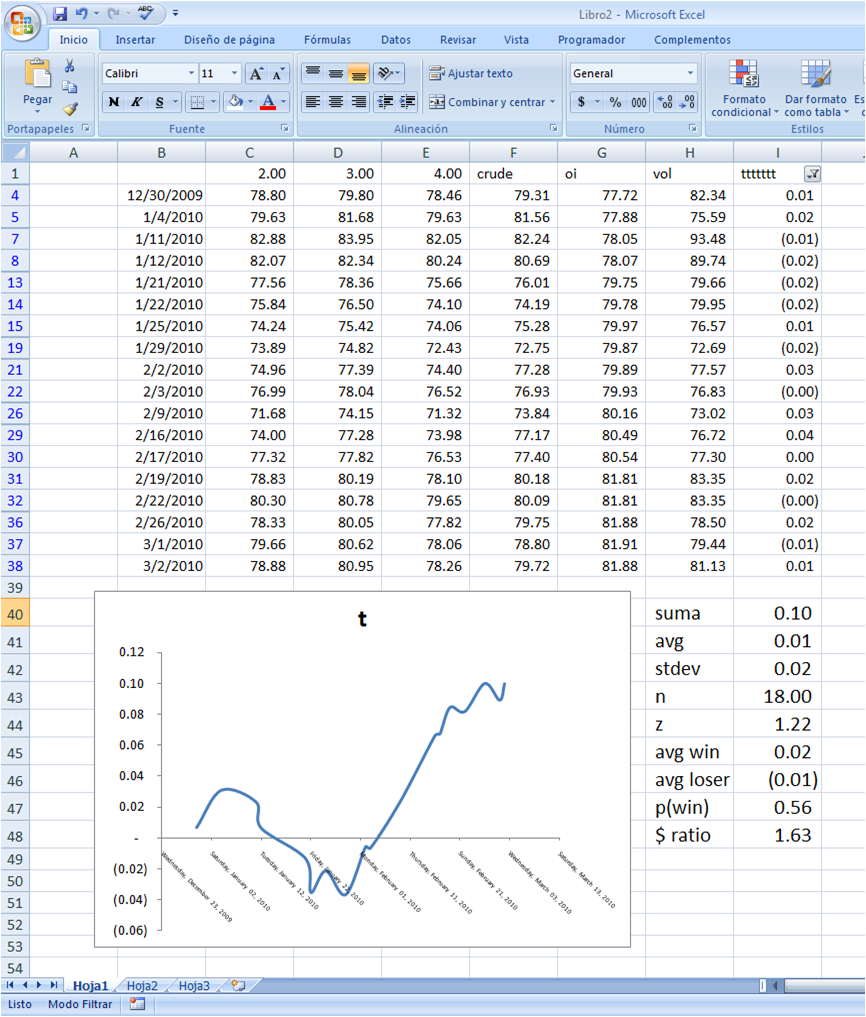
if today’s option volume price is higher than yesterday’s, then buy at the open tomorrow and sell at the close.
Although I think it’s a nothing system. I’ll think about it later.


In the UBS commodity index there seems to be a shift in the correlations among the subsectors. Specifically grains, softs and precious metals are above 0.60 in correlation against the major index. That’s a jump from an average of 0.30 back in V9.
Also energies and industrial metals reduced marginally their dance rhythm against the UBS average as they ticked down 2 points; Like from 0.87 to 0.85.
Although the change might no be statistically significant, I want to know if there is a fundamental shift in the fact that tropicals are being more influential on the index. Specially when the DX has been climbing strong during this time.
I sense that the answer rocks in the nat gas market. There might be a paradigm change that’s influencing the rest of the commodity complexes.
Options on futures.