Probability Fundamentals
CFA Level I. quantitative methods

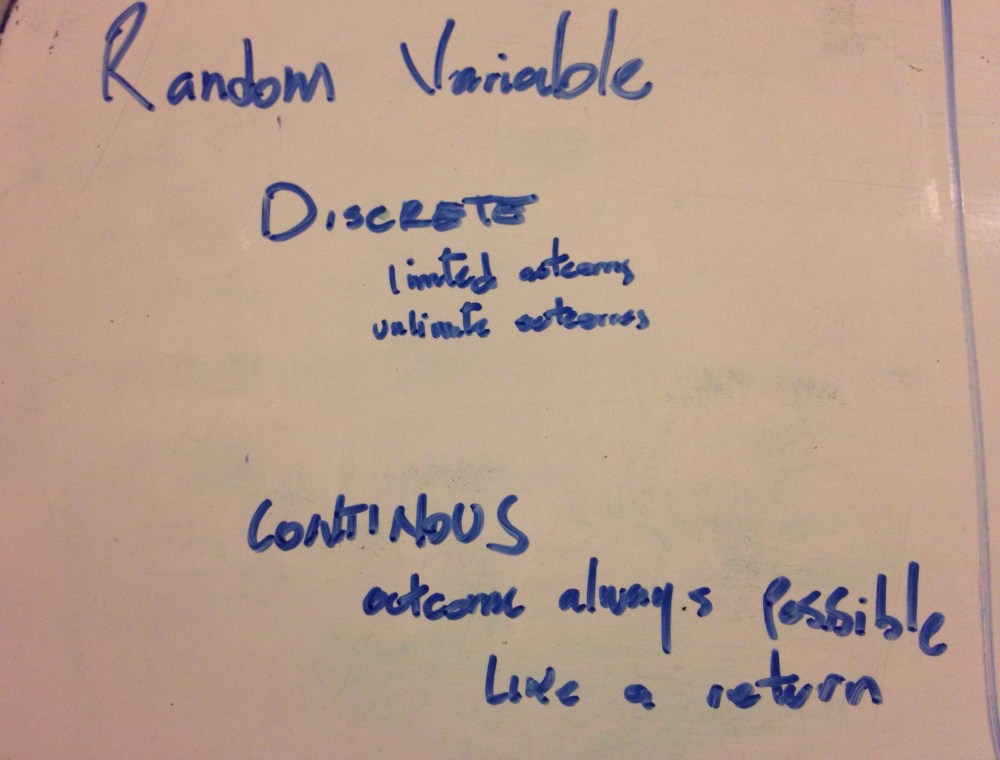


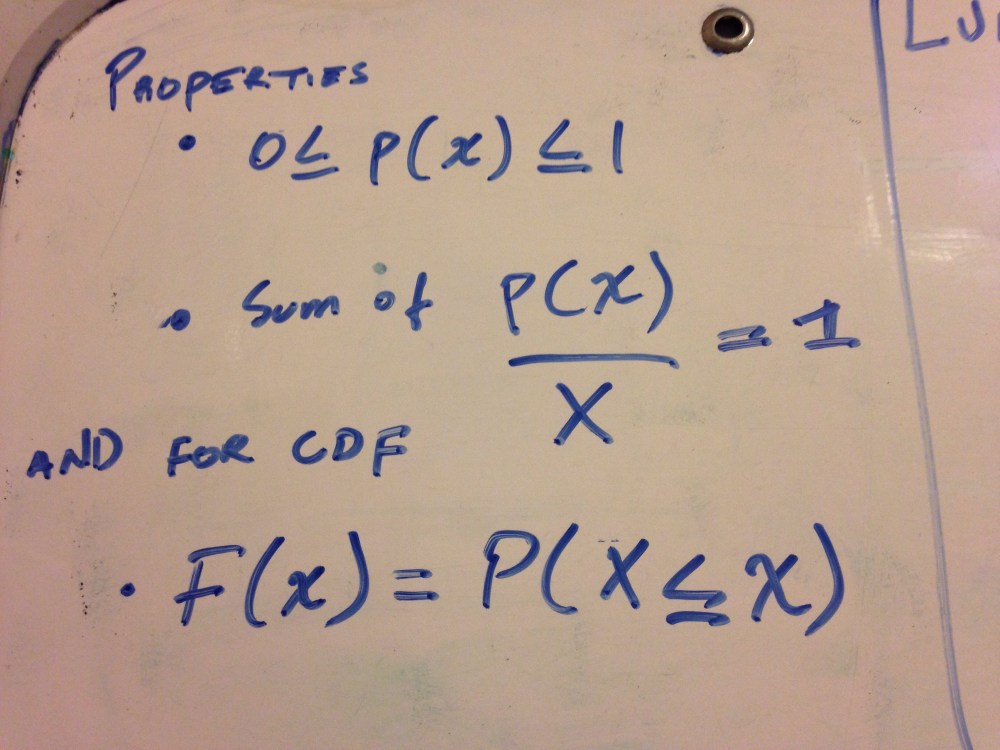
Discrete random variables:


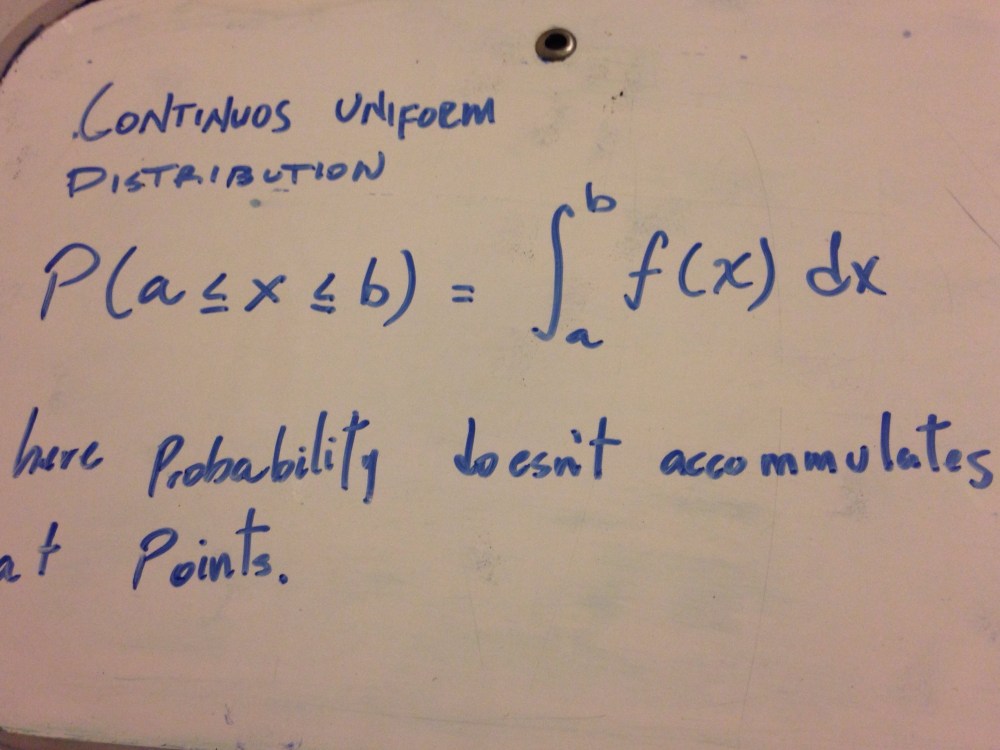
Next ones belong to the continuos type of random variables.


CFA Level I. quantitative methods
Discrete random variables:
Next ones belong to the continuos type of random variables.


We are currently studding a strategy for CL. Basically it says that if the percentage change in the 22d relative ATR is lower than –3% then a short position must be executed at the close of the session and buy it back at the close of the next day. Also if the percentage is higher than +3% then long position must be established at the close of the session and to be sold at the end of the next day.
So far we got a z-value of 2.8 without stop-loss using our data mine of daily CL prices since 1986. So far this 209 the overall return would be about 60% with a draw down of 20% in march.
What’s the next step?
1) try another percentage changes like four, five and so on.
2) add an stop loss to the system itself for smoothing the draw downs.
3) paper trade it for at least one week.
Although I was not the trader, just the executor, I find it quite an interesting trade for my education.
It is 8.50AM [10.50 ET] on July 1st 2009. Paulo asks me for quote in a long put at 850strike for Q expiration. Then he finances part of the long position selling a call quite away of market price: 1010. While this was being executed ESU9 quote was around 928.
buy one 850 put at 11.00 points, which had a delta of 0.97.
sell one 1010 call at 3.5 points, which had delta of .98.

In the way out:
sell one put at 18.00 points. delta of 1.0017 [negative of course]
buy one 1010 call at 1.85 points. delta of
The market was falling 2.89 percent and the position was closed. [very poor jobs report if you get philosophical]
Questions I should answer:
1) How could we calculate the alpha of this trade?
2) What was the risk/reward ratio?
3) What was the stop loss? if any existed.
4) Is this the name of “syntetic short” ok for this position?
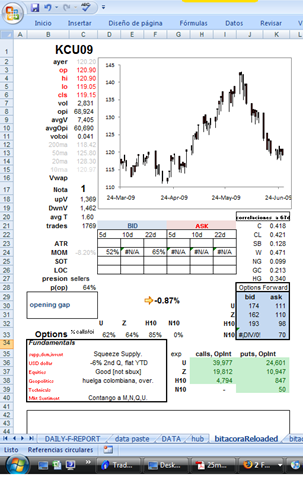
I have reloaded my closing file. In the last version I had to move the mouse too many times for checking some facts of one single market. With the new version I am able to see most of a market’s characteristic in one single space.
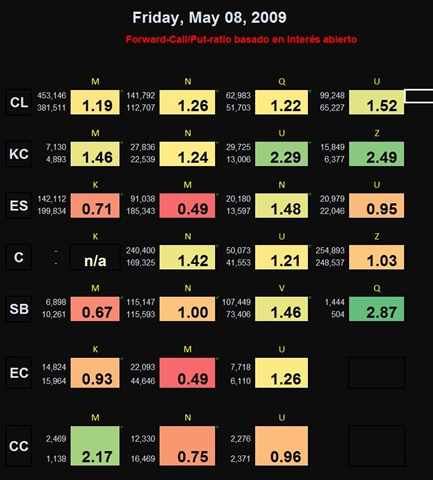
Also I have added a probability surface for ATR, MOM, LOC, and SOT. This is the main reason why the closing file is going to be called “Commodity Scouting Report” because I will have a panoramic view of how has done the market is previous rhythms like present. For example in coffee, where we have seen a collapse of 140 to 118, MOM is suggesting that there are some probability of success if we face the bid size and holding such position for five and for twenty two sessions. Plus put/call ratio helps a little telling the the mkt’s subconscious is located. In the case of coffee calls are dominating the open interest which helps to sustain the hypothesis proposed by MOM (primitive momentum).
I have to schedule the quantification for the rest of indicators and for the rest of the markets including the new ones. Hope to have all finished around September.

CC: 0.82 Y 0.93
N= 13582calls + 16578p, U= 2267c+2441p
LONG ESK9 P760 @ 8
SHORT ESK9 C920 @ 3.45
Delta
| 28j9 | |
| put | 0.2247 |
| call | 0.3196 |
| 24j9 | 27j9 | 28j9 | |
| call | 0.1690 | 0.2564 | 0.5333 |
| put | -0.0901 | -0.0359 | 0.800 |
El SP500 ha estado subiendo, de 848 a 856, tocando el 866.
Esto va de a cuerdo con los primeros dos dias compilados del put porque la primera derivada es negativa. Pero hoy (28j9) el mkt bajo y la put tambien. ESTE es el time decay. Asi ambien el call bajo y el futuro tambien por lo que la 1ra derivada salio positiva. El time decay se es el signo inverso de la derivada. Al dia de hoy el time decay se hizo presente.
Vega
me toca la proxima y tengo que hacerlo con toda la data.
Delta: 1st d of option relative to the underlying.
Theta: is the negative of the first derivative of the option respect to the time remaining until exp. Also known as TIME DECAY.
Vega: is the 1st derivative of an option respect to the volatility [stdev] of the underlying. Also known as kappa, lambda, sigma.
Rho: 1st derivative of an option respect to the interest rate. Calls: +. Puts: -. In general options are not very sensitive to rho.
Gamma: Does not measure sensitivity to underlying’s price like the above. Instead, measures how delta changes with changes in the underlying’s price. The gamma for a C or a P is the same, always, and can be either positive or negative. Gamma is the second derivative of the option price with respect to the stock price.
Next post is about option strategies.
Fuente: Fut, Op +Swps, Robert Kolb. 3rd ed.
¿Como se relacionará el Vega con el ATR?
Calculo de real time for delta y vega para sacar estrategias o ponderar probabilidades para el underlying.
Cuando compré el CLM9-9000C no solo esta deep out of the money, tambien el vega es bajísimo porque el crudo esta atrapado en un rango aburridísimo. Too late, pero lo mejor habria sido irse con el gamma: sell options out of the money covering blackswans.
