Ichan: Dellrox
Con Dell regresando a la Bolsa, y Carl Ichan en medio, quizás una aventura entre Dell y Xerox produzcan un bebé: Dellrox.
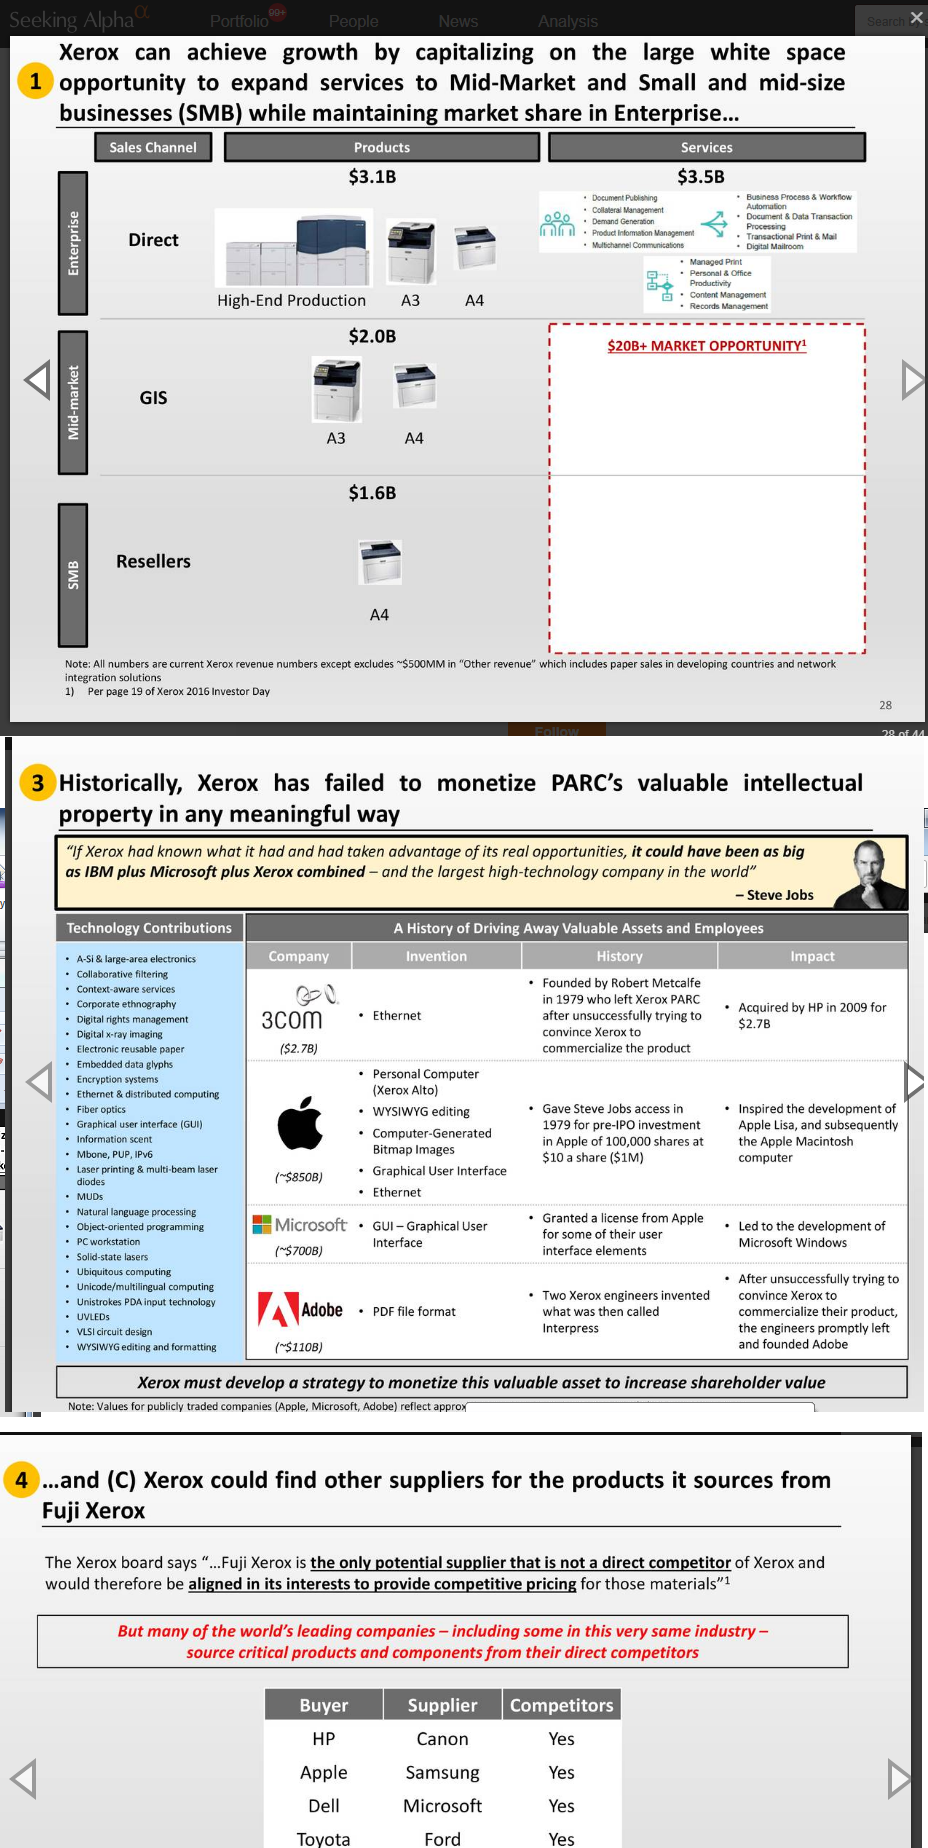
Con Dell regresando a la Bolsa, y Carl Ichan en medio, quizás una aventura entre Dell y Xerox produzcan un bebé: Dellrox.
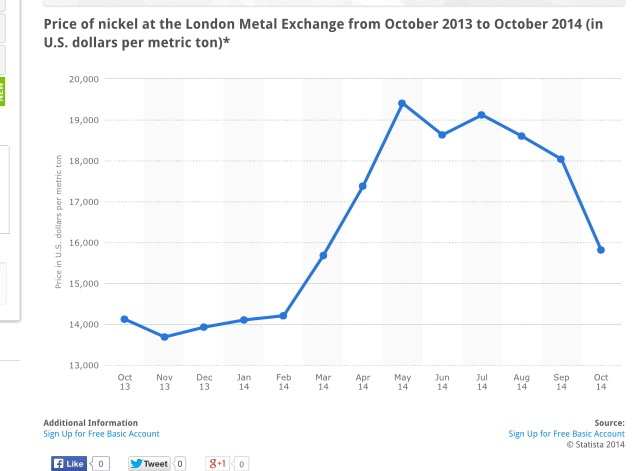
If everybody is buying more gadgets, why is it falling?
A couple of good friends, from my “eco” group, requested me to do all the paper work for opening a forex account. I suppose to design the strategy and show them what I got when I finished. They wanted to start with US$200. In part this is what made to stood still and do nothing.
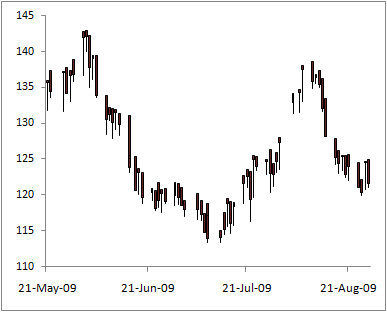
If I had opened the account I would have gone long the euro back then on July 09. Buy at 1.4150 and today the mark to market is 1.4565, discretional trading. But I would look for a weekly positional strategy.
Although the average daily volatility would have squeeze the $200, I have this feeling of frustration for not getting long in that long term rally.
BUT
1) I don’t have the amount of $ for establishing a positional system [taking that volatility].
2) I am focusing on scalping the Oil. Either with USO or long in-the-money-options in the futures.
3) I really have no more space in my daily agenda for deepening in market study. I think this will be possible about the end of 2010.
4) For now, I rather build the sources that feed the trading account and do research in the mean time.

When I began to write this post I was about to say that coffee is more volatile from the rest of the markets I follow. But then I thought “before thinking about this, I should rank the relative ATR for this mkts”. Here is what we have:

Coffee is not the most volatile commodity among my tickers. Basically those are energies like NG and CL… and sugar. NG is almost double KC’s average true range related to the last closing price.
There is a little opportunity here: We have upward potential for 5 and twenty two days with a z value of two and 47% and 35% probability of loss respectively. But the expected value are too short: 1% for the 5 day strategy and 4% for the 22day. This is not based on ATR but in an indicator, which I was learned a couple of semesters ago, named Location which basically measures how away is the last price from its trends resumed by long term moving averages.
Also I want to see the Options. And we have this:
One month ago from this post the call/put ratio was 1.94 and today it is 1.90. No difference you may say. But the open interest dropped 53%. There was 83k calls in the beginning of august and 42k puts.
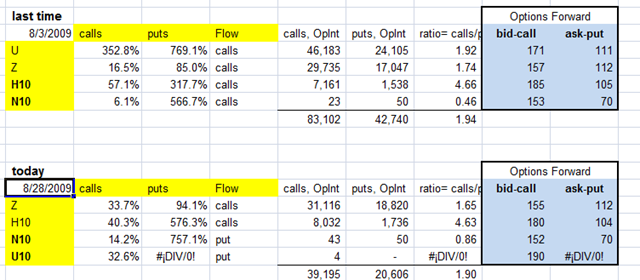
So in options we have the same “expected” scenario but with lesser voters willing to risk their capital supporting this.
Apparently in KC the bid call indicador [email me if want to know about this at joachin[at]ufm.edu] the singal is a reversal because we have had call weight but puts’ levels are closer to reality.
What if we sell some calls at 160 and sell some puts at 112 in the Z month? Let us paper trade it.
Although I was not the trader, just the executor, I find it quite an interesting trade for my education.
It is 8.50AM [10.50 ET] on July 1st 2009. Paulo asks me for quote in a long put at 850strike for Q expiration. Then he finances part of the long position selling a call quite away of market price: 1010. While this was being executed ESU9 quote was around 928.
buy one 850 put at 11.00 points, which had a delta of 0.97.
sell one 1010 call at 3.5 points, which had delta of .98.

In the way out:
sell one put at 18.00 points. delta of 1.0017 [negative of course]
buy one 1010 call at 1.85 points. delta of
The market was falling 2.89 percent and the position was closed. [very poor jobs report if you get philosophical]
Questions I should answer:
1) How could we calculate the alpha of this trade?
2) What was the risk/reward ratio?
3) What was the stop loss? if any existed.
4) Is this the name of “syntetic short” ok for this position?
Today Monday at noon I was closing the markets, noticing how oil and pretty much everything else, excepting bonds, keep growing in percentage returns since the middle of may.
I glanced to my K closings and realized that I was predicting bearish patterns for oil and for the SP500. I was absolutely wrong, and the ugliest part was that I never realized how wrong and for how long I maintained during the 2nd part of may.
Finishing this daily routine I went to check out the “spec” label in my email to see what the traders in the boston group were saying.
There was this email of this folk who asked about how to keep a trading journal without an existing strategy. The basic answer for everybody was that it makes no sense to keep a journal if you don’t use a strategy.
If you keep a trading journal without strategy, what you are witting down is your pain and self regretting with no proposition of improving. It’s pretty much, in catholic terms, to make the sacrament of reconciliation without a plan of abandoning that virus of sin.
Some of the answers of the fellow traders were somewhat like “my journal is ‘did i follow my plan?'”
That makes much more sense because if you followed your plan and losses aroused, then what you can do is to study if there is a change in the pattern you were dancing or just a business-as-usual stop loss.
This is to say that I am falling in this problem too because I have been trying to write market predictions in my journal without any strategy in hand.
That is the reason why I will create self-expectations based only on indicators making paper trades and curing the databases.
That is why, as they say, Plan your trade and trade your plan.
LONG ESK9 P760 @ 8
SHORT ESK9 C920 @ 3.45
Delta
| 28j9 | |
| put | 0.2247 |
| call | 0.3196 |
| 24j9 | 27j9 | 28j9 | |
| call | 0.1690 | 0.2564 | 0.5333 |
| put | -0.0901 | -0.0359 | 0.800 |
El SP500 ha estado subiendo, de 848 a 856, tocando el 866.
Esto va de a cuerdo con los primeros dos dias compilados del put porque la primera derivada es negativa. Pero hoy (28j9) el mkt bajo y la put tambien. ESTE es el time decay. Asi ambien el call bajo y el futuro tambien por lo que la 1ra derivada salio positiva. El time decay se es el signo inverso de la derivada. Al dia de hoy el time decay se hizo presente.
Vega
me toca la proxima y tengo que hacerlo con toda la data.
Delta: 1st d of option relative to the underlying.
Theta: is the negative of the first derivative of the option respect to the time remaining until exp. Also known as TIME DECAY.
Vega: is the 1st derivative of an option respect to the volatility [stdev] of the underlying. Also known as kappa, lambda, sigma.
Rho: 1st derivative of an option respect to the interest rate. Calls: +. Puts: -. In general options are not very sensitive to rho.
Gamma: Does not measure sensitivity to underlying’s price like the above. Instead, measures how delta changes with changes in the underlying’s price. The gamma for a C or a P is the same, always, and can be either positive or negative. Gamma is the second derivative of the option price with respect to the stock price.
Next post is about option strategies.
Fuente: Fut, Op +Swps, Robert Kolb. 3rd ed.
¿Como se relacionará el Vega con el ATR?
Calculo de real time for delta y vega para sacar estrategias o ponderar probabilidades para el underlying.
Cuando compré el CLM9-9000C no solo esta deep out of the money, tambien el vega es bajísimo porque el crudo esta atrapado en un rango aburridísimo. Too late, pero lo mejor habria sido irse con el gamma: sell options out of the money covering blackswans.
