Why They Have Never Used the Black-Scholes-Merton Option Pricing Formula
Espen Gaarder Haug & Nassim Nicholas Taleb
PDF fileSSRN-id1012075.pdf
Espen Gaarder Haug & Nassim Nicholas Taleb
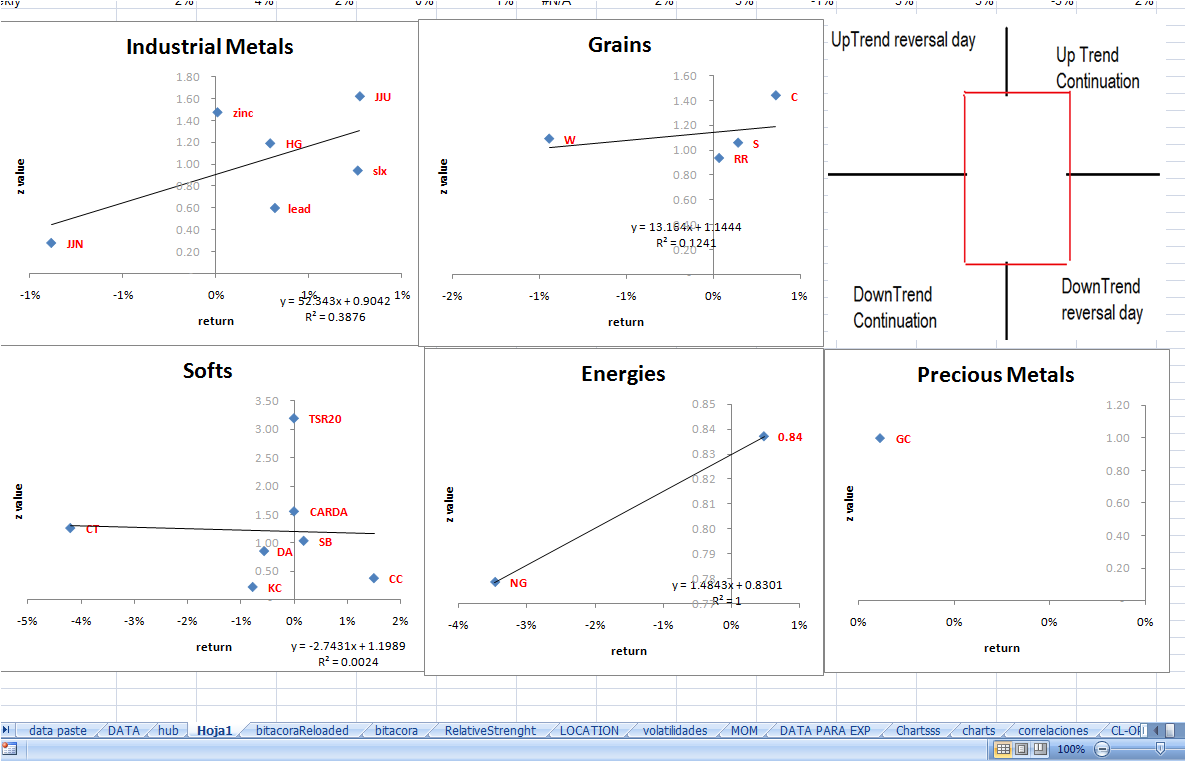
this print screen will serve me as a reference in the future regarding the steepness of the market and the day’s percentage return for the 2010 start.
The steepness of the mkt is measured by the z value of the last 67 days, meaning:
For the last 67 sessions please compare the average return with the normal volatility for a single day: average divided the result of dividing standard deviation in the square root of 67. If the result is grater than three, then the avg return is consistent because the normal growth is three times the usual volatility.
If I compare the 67-day resume against today’s return, then we can infer if we are in continuation, reversal or neutral activity according to the prevailing trend; like a strike zone as the one the upper right side red square.
I think this is a good method for discriminating what markets should be excluded from sight or maybe a pattern-report for building more abstract positions like selling volatility (inside the red strike zone) or getting other trend following positions for the ones outside the red square.
Back Testing it is the next step.

FROM : ARE FINANCIAL MARKETS EFFICIENT? p25
At the most general level, behavioral finance is the study of human fallibility in competitive markets. It does not simply deal with an observation that some people are stupid, confused, or biased. […] BF theory rest on two major foundations. The first is limited arbitrage, the second namely investor sentiment.
Limited arbitrage suggest that arbitrage in real world securities markets is far from perfect. many securities do not have perfect or even good substitutes, making arbitrage fundamentally risky and, even when good substitutes are available, arbitrage remains risky and limited because prices do not converge to fundamental values instantaneously. The fact that arbitrage is limited helps explain why prices do not necessarily react to non-information expressed in uniformed changes in demand. Limited arbitrage thus explains why markets may remain inefficient when perturbed by noise trader demands, but it does not tell us much about the exact form that inefficacy might take. For that, we need the 2nd foundation of behavioral finance: investor sentiment: the theory of how real world investors actually form their beliefs and valuations, and more generally their demands for securities. Combined with limite arbitrage, a theory of investor sentiment may help generate precise predictions about the behavior of security prices and returns.
if arbitrage is unlimited, then arbitrageurs accommodate informed shifts in demand as well as make sure that news is incorporated into prices quickly and correctly. Markets then remain efficient even when many investor are irrational.Without investors sentiment, the are no disturbances to efficient prices in the fist pace, and so prices do not deviate from efficiency. A behavioral theory thus requires both an irrational disturbance and limited arbitrage which does not counter.
During the last resting days I spent two weekends at the beach and I read The Daily Trading Coach and Fooled by randomness from NN Taleb.
Main ideas I will rewrite then:
> emotion and reasion [taleb]
> rationality, emotions and trading [taleb]
> what it takes to be a full time trader [brett]
> new tool to add at the jornal [brett]
* Everyone has a stop-loss level: For some, it’s a price; for others, it’s a pain threshold.
* It’s not stress and emotion that get in the way of trading; it’s the stress and emotion that results when trading becomes personal: about you, rather than about supply and demand.
* The measure of a trader is how hard he or she works when markets are closed.
* When traders don’t track their results, it’s because they don’t want to know them.
* The best traders have a passion for markets; the worst have a passion for trading.
* When it comes to market history, there are only two choices: trading with awareness of it, trading in ignorance of it.
* I recently encountered a daytrader of currencies who was trading EUR/USD with high leverage. News came out in Europe and the market blew through the trader’s mental stop-loss. The trader had no idea that an economic report was due at that time; he was only looking at chart patterns. That represents trading at its worst.
* Losing a job or not wanting a 9-to-5 one is not the right reason to pursue trading.
* Markets tend to move in the direction of the greatest number of stops.
* The best traders are not relaxed *and* they are not anxious. They are alert.
* Deep down, traders who don’t prepare don’t feel they deserve to win. We always gravitate toward our just desserts.

I am trying to get out of a long put for the crude H at 75 strike. We got it for $2.54/b and I want to sell it for 3.21 while the last and only trade so far has ben at 2.96.
Hitting the wrong buttons, 231 instead of 321, showed the delta that MFg is using and the limit price change for this option. The interesting fact is that Trade Station tells about a delta of 0.3335.
I wonder how they get those bands? is it relative to the underlying? obviously since delta goes with the futures price.
Apparently for the theoretical value get to 227 the underlying should move 80%. [as I write the market goes to 255 because crude exploded from 7336 to 7440, overshooting the Vwap; I move the limit order down to 270, then to 260, las quote was 255, my Boss tells me to close the position since I am not coming tomorrow, so I move to 259, I am worry because we have no stoploss level and when there is such no target, you have to get out instantly, ……….Connection goes off, I have to restart the platform which means 2 minutes way, the system goes back (I the background I am listening “Bienvenida emproista”) the system comes back and instantly I got the “order fill” alarm. We went out at 259.
So the delta was telling me that a tough move was needed to get to the lower band, and when I was thinking about it (learning) the market gets a violent move upwards and basically end up buying at 255 on friday and sell today at 259.
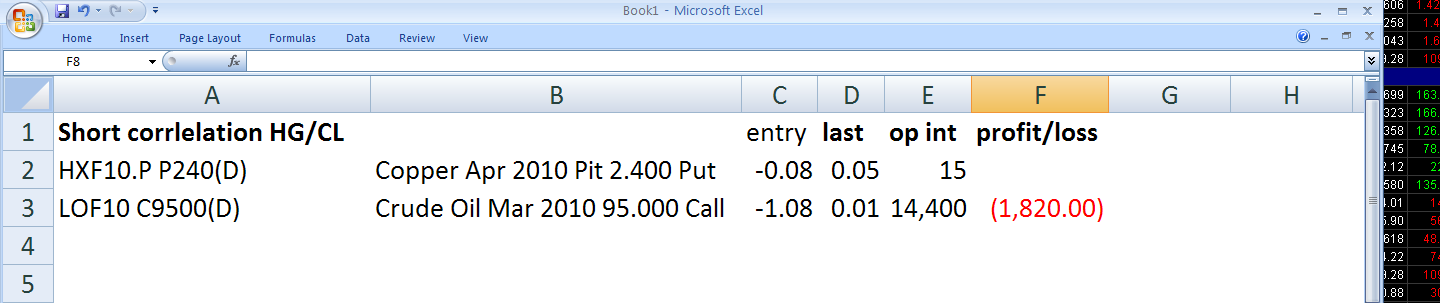
When the trade was thought correlation was 0.60; 44 workdays , 66 days, including weekends, later the correlation is 0.64. So I got it wrong.
The profit ratio I wanted was 3 to one and open-minded for a loss of $2k. Stop loss was hit at $1820, under the supposition that copper’s put would be easily sold.
Rob Hanna’s interview by Kirk.
Concepts that I should follow more:
breath
volume
price action
sentiment
volatility
Borrowed from here: http://www.quantifiableedges.com/kirk-hanna.html
