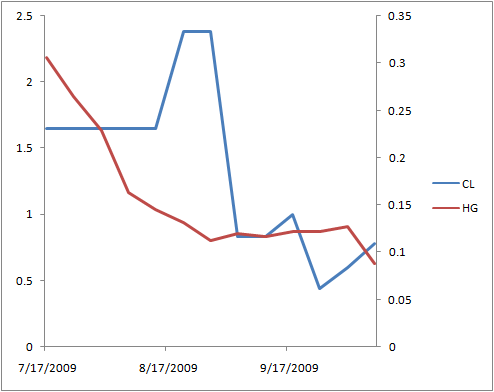
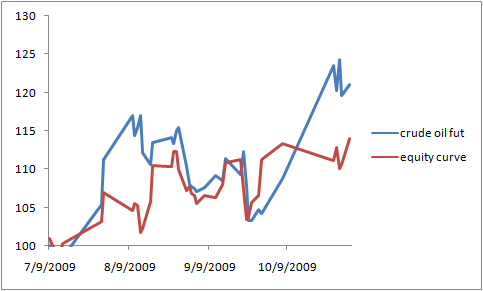
testing oil intra day with the Vwap

Signal of the coach: go long at 830am if yesterday you had a positive VWAP. If not, do nothing.


from July 3rd to November 5th.

Result: It would have been better parking the money on a long position get it out today. The market return was higher and we are not considering transaction and slippage costs.

image 

You might say: try leverage!

Well I am not sure with this facts:

z value: 1.05

w/L ratio: 1.29


So what I will do is run the whole process back testing the adverse intra day scenarios. Leverage to use will be 1:3 since the max loss is -3.7% then that would be 12% draw.

Any way the short z value tells me that with leverage I just will turn figures up. Unless I systematize the leverage: check if the strategy has a pattern to increase positions because of a given opportunity.


Also using only price, and a good z-value means some supply/demand effect converted intro profits.

Let us short a correlation

67 day correlation between CL and HG is 0.60. 1400 day correlation is 0.37. This is saying that both commodities have been extremely friendly each other and that is not regular.


This is a paper trade of 90 days, so I will chose January options:

I will be willing to risk two thousand dollars and would be satisfied with with a R of 3, so a profit of six would be a like double play in a tied game.


B 1 CLF10-9500C @ 1.08

B 1 HGF10-240P @ 0.08

Debit account if margin would equal 100% = -1.08*1000 -25000*0.08 = -$3080 minus fees and commissions.


I should notice that I am seeing CL and HG but actually I would be trading derivatives on these futures; i.e. options prices might not be correlated and risk is being amplified.


The fact that both positions will be long options doesn’t mean risk of loss is being reduced because of greek fundamentals. I mean, The max loss would be 100% of the position, but the probability of hitting -100% is higher, so the trade is actually quite maverick-like. Using futures volatility is high, but liquidity risk is lower.


image


According to my position, both red and blue line will go up. Maybe it would better using spreads instead of naked long options.


THIS POSITION WILL BE CLOSED ON FRIDAY DECEMBER 18 2009.

Checking Amaranth’s strategy

image

I happen to be a teacher in a futures workshop for UFM’s business school for the students on the financial carrer, MFIN. We checked the Amaranth’s case and we came up with the idea of replaying this strategy.


Amaranth’s leverage, according to the written case published at a financial journal, was 1:5. There you can see a little negative spike of -$3700 to -$6040, meaning a 60% movement against the position. Using a 1:5 leverage means that we control $100 worth using, or having, only $20; so if the position moves 5% against us [which is quite natural in this mkt] we are losing 5/20 or 25% of the position.

What seems was the Amaranth’s case is that they got at leas a 50% adverse move which means an imminent wipe out.

They got plenty of margin calls, phone calls from the exchange and all of that ended in convocation of other nat gas traders to take care of these positions.

As the chart can tell, months later, the trade was a pure winner, but the trader wasn’t because misuse of leverage.

This make thing of a baseball play. Two men on base, double play setup in the infield. I am a left hand pitcher facing a right and weak hitter. As I prepare for facing the hitter, the center fielder stars arguing with the short stop about his way of playing. They finally calm down, although the SS refused to hear what the other guy was saying, so I come up with the pitch [inside fastball] and nice and easy ground ball goes by the short stop position, but he couldn’t get it because did not move himself as the CF was telling him. Nice strategy, poor risk management. We ended up facing about 5 more hitters and finally lose the game.

Swing and blogging

I feel that I can’t resume my market thoughts so often like other traders. I know I am no a full time trader, but I see markets all the time.


By now I am in a situation like I was in the batting practice two weeks ago: when it came the second turn take 24 swings in the batting cage, bi the 5th swing I couldn’t continue as solid as the other contacts with the ball. I couldn’t move the arms and the shoulders to meet the ball with my momentum because of lack of energy.


Same here at blogging. I need more conditioning in both sides of this speculative life. The curious thing here is the role that alimentation has: A good eating system will create good opportunities for both developing the physical conditioning for a decent batting practice and for a vividly experience in the market’s sessions.


What about coffee

When I began to write this post I was about to say that coffee is more volatile from the rest of the markets I follow. But then I thought “before thinking about this, I should rank the relative ATR for this mkts”. Here is what we have:


 imageimage


Coffee is not the most volatile commodity among my tickers. Basically those are energies like NG and CL… and sugar. NG is almost double KC’s average true range related to the last closing price.


There is a little opportunity here: We have upward potential for 5 and twenty two days with a z value of two and 47% and 35% probability of loss respectively. But the expected value are too short: 1% for the 5 day strategy and 4% for the 22day. This is not based on ATR but in an indicator, which I was learned a couple of semesters ago, named Location which basically measures how away is the last price from its trends resumed by long term moving averages.


Also I want to see the Options. And we have this:

One month ago from this post the call/put ratio was 1.94 and today it is 1.90. No difference you may say. But the open interest dropped 53%. There was 83k calls in the beginning of august and 42k puts.


image


So in options we have the same “expected” scenario but with lesser voters willing to risk their capital supporting this.


Apparently in KC the bid call indicador [email me if want to know about this at joachin[at]ufm.edu] the singal is a reversal because we have had call weight but puts’ levels are closer to reality.

What if we sell some calls at 160 and sell some puts at 112 in the Z month? Let us paper trade it.