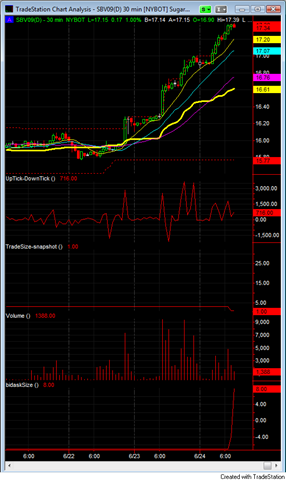
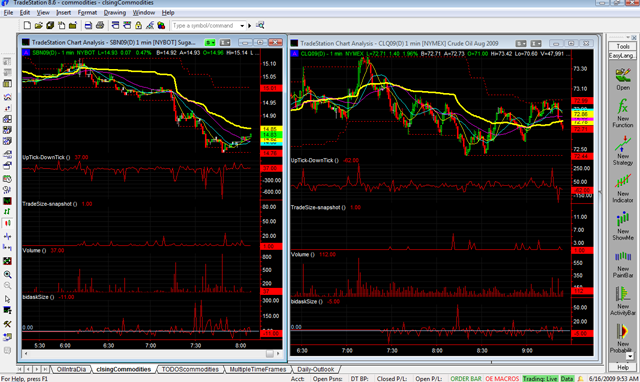
Nice execution

Although I was not the trader, just the executor, I find it quite an interesting trade for my education.


It is 8.50AM [10.50 ET] on July 1st 2009. Paulo asks me for quote in a long put at 850strike for Q expiration. Then he finances part of the long position selling a call quite away of market price: 1010. While this was being executed ESU9 quote was around 928.

buy one 850 put at 11.00 points, which had a delta of 0.97.

sell one 1010 call at 3.5 points, which had delta of .98.


image


In the way out:

sell one put at 18.00 points. delta of 1.0017 [negative of course]

buy one 1010 call at 1.85 points. delta of 


The market was falling 2.89 percent and the position was closed. [very poor jobs report if you get philosophical]


Questions I should answer:

1) How could we calculate the alpha of this trade?

2) What was the risk/reward ratio?

3) What was the stop loss? if any existed.

4) Is this the name of “syntetic short” ok for this position?

My new close – Commodity Scouting report

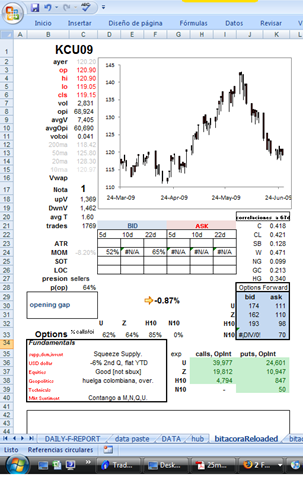
I have reloaded my closing file. In the last version I had to move the mouse too many times for checking some facts of one single market. With the new version I am able to see most of a market’s characteristic in one single space.


Also I have added a probability surface for ATR, MOM, LOC, and SOT. This is the main reason why the closing file is going to be called “Commodity Scouting Report” because I will have a panoramic view of how has done the market is previous rhythms like present. For example in coffee, where we have seen a collapse of 140 to 118, MOM is suggesting that there are some probability of success if we face the bid size and holding such position for five and for twenty two sessions. Plus put/call ratio helps a little telling the the mkt’s subconscious is located. In the case of coffee calls are dominating the open interest which helps to sustain the hypothesis proposed by MOM (primitive momentum).


I have to schedule the quantification for the rest of indicators and for the rest of the markets including the new ones. Hope to have all finished around September.


image

Qué quemón en el azucar

SB has been quoting at abnormal prices in the past two sessions. Yesterday I got a reverting signal selling today’s open.


We had pattern continuation which is translated in paper losses.


The problem is I remember the signal algorithm but I cannot recall of an exit strategy, i.e. a stop loss.

The entry was take the opposite direction of yesterday’s move if the ratio between volume and open interest is 20% above of the monthly [22d] moving average of vol/opInt.

There is good Z for this algorithm, but the stoploss is restricted to 2%. I need a heavier approach to the stop loss, at the least: the same mental effort of the entry algorithm.

As I type, probably I would be trying to hold the position with the hope a possible profit.


So, answering to the daily question of “what I am going to do wrong today, how would I lose?” I must be honest that avoiding risk management would be it.

Also I missed the rollover of N to V, which in first instance would stopped the execution process.

  Check it out:SBintraday [eleven bars of pain, unnecessary pain]

To bear in mind

What I am going to do wrong today?


What would you to do lose money? pick losing strategies.


Spec is about making mistakes. What separates winners from losers is that winners take small loses and losers make BIG mistakes.


If you seek to learn, do it from your mistakes not from your success.


Denial is a powerful defense mechanism while rationalization is a powerful coping mechanism.

What’s the probability of CL to continue rising?

It has been nine straight weeks that this future has reported ten week moving average above the 20w ma.


Since 1983

image


So that the probability of this market to continue marking this pattern is 40%.


There are two times where this continuation was 19 weeks: the first time was from September 26 of 1986 to Feb 13 of 1987. The second time was twenty years later starting from Sept 14th of 2007 to January 18th of 2008. In the second one price went from 74 to 93 and in the first went from 14.12 to 16.39, 25% and 16% respectively.


CHECKING STRATEGIES: result: negative

Now in the nine week extension there are four samples:

using 2% stoploss


Sample one

27V89 to 22Z89

price return: +7%

strategy: +1%


Sample two

26H99 to 28K99

price return: +15%

strategy: -1%


Sample three

16U05 to 11X05

price return: -11%

strategy: -6%


Sample four

17J09 to 12M09

price return: +37%

strategy: +34%


The +34% return is more of a random result.

Oil is not in the zone of the other commodities [dx, bourse, bonds]-puts are way to heavy

Again winner on W. selling the open and buying the close. at least 15 tick on profit, or $700 or about 7% using 1:3 leverage on a $30k contract size.


There was a big order in coffee of about 20 contracts which made the price go from 128 to 130 where it closed. In positional trading, it is still finding this soul around the long term alignment.


It seems that sugar is building a trading range. ATR is on S, the trade wight is weak, below 3, and price is on S-. Wait for energy biofuels fundamentals for action. I have never seen this mkt in the intraday. I will check it out tomorrow. I should see it since the size is pretty nice for spec.


560 is a key level on W.


New highs on CL. Divergent volume. opening gap and low trading range in spite of fundamental bullish. It might very well start a trip to the south. I should check the 10d MAs system in a reverse manner for seeking bearish profit potential.


Gold had a DIV on a +day which is a hight probabiltiy of selling off tomorrow (today).


I have nothing for copper. I should try a positional just for matter of knowing the mkt.


There is a big problem with TS when internet falls because I can’t follow my most recent indicators for the bid/ask battle.


There are like 3 systems in oil which I should be papertrading.

Metals leading, bonds finding bottom, dollar weak, equities stalled at long term trend-Nice volatility among cmmdts

What does coffee and sugar after a LowTradingRange in 1d, 2d, 3d, 4d and 5d?


Heavy activity in W and C. Everybody is covering the weather expectancy. The long trade in W would have been profitable and now it has a sell signal for the opening of tomorrow.

Volatility is getting in the grains, firstly a long time ago with S, now corn is the one big fish pending to get in the party.


Buyers were dominant among most of commodity sessions excepting KC which had divergence closing up at 131 but with a selling dominance, let us not forget that this soft is on existential quest around is long term trends and option surface indicating a lower price expected after third quarter.


Wheat: Head and shoulders pattern

image


MOVING AVERAGE SCORES

GRAINS 2.02

ENERG 2.5

SOFTS  1.71

METALS  3.8 [watch hg]

DJAIG  3.5

avg  2.5

bolsa 4.0


image


image

dollar and bonds for commodities and stks

Coffee has been pulling back from the 140s and apparently has a philosophical issue at 130s. We have 2 straight XMD.


Sugar was flat with divergence on volume. Options are on the call side in a violent manner.


Agriculturals are down on the opening week dancing with the dollar.


Oil has been trading in a violent manner with real volume indicator above its 22d moving average. And nat gas has the same pattern. Possible the put signal is getting realized and specs are rolling over positions, one of them USO, specially since today it was scheduled it’s roll over on futures.

On Friday sell volume was dominant and today was continued excepting sugar and nat gas.


Buying signals on W [open to close]. graphically there might be a headandShoulders pattern.


Top commoditiy: energies -0.5%, worst: grains -1.5% the best contract was SM +1.41% and the worst of all O -5.66%


OIL:  Put open interest weighted is at 69 and the underlying is trading at 68. Also delta for adjacent strikes is weakening.

Dcarley bond report said:


The short end of the curve continues to suffer from selling pressure as safe haven cash is being reallocated to better paying assets. As it turns out, the T-bond was one of the beneficiaries.

The Fed was on the buy side again today. The central bank purchased $7.5 billion out of the $29.97 billion offered in maturities ranging from 4 to 7 years. This was an improvement over the last outing of similar securities. It seems as though some of the gains in the 30 year may have been due to rumors that the Fed may be making a move to expand their bond buying program. After all, thus far their attempts to keep rates low hasn’t materialized.

The U.S. dollar index moved moderately higher on the session to post what has been a solid rally from last week’s lows. If this continues to be the case, we feel like the index could see the mid-83’s in the coming week or so. Assuming this becomes a reality; bonds should follow the currency higher.

However, we all know how resilient the bond bears have been thus far in thwarting many of the usual inter-market relationships. Bonds and notes dropped as stocks rallied, but the turnover in stocks failed to spark Treasury buying. We feel as though the S&P could see 910 in the coming sessions but whether or not bonds will benefit, as would normally be the case, is yet to be seen.

It was a slow news day and tomorrow will be much of the same but things start to pick up on Wednesday. We will hear about the Fed’s Beige Book as well as the Treasury budget (which is important in terms of market supply of debt). Retail sales on Thursday will also be closely watched due to the consumers role in the potential recovery.

We see meaningful support in the September T-bond futures at 112’07 and resistance near 117’29. At the same time, support in the 10-year note should be found at 112’26 with resistance at 116’04.

New team of indicators

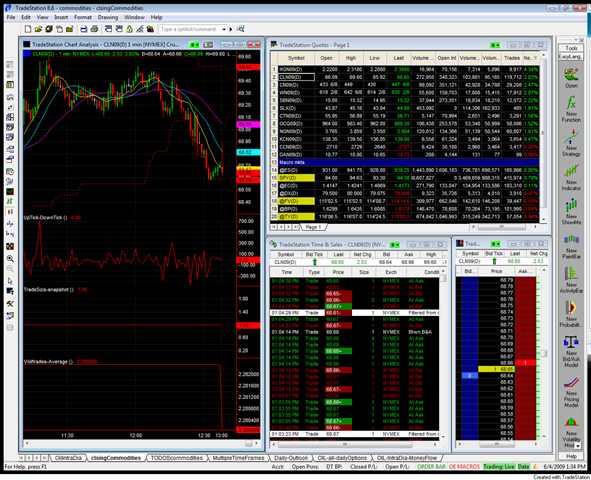
I just found a way of checking when the sharks are in town.


UpTick-DownTick

Its the result of substracting the dwntick from the uptick. So the result is the number of transactions executed above (>0) the last trade or below (<0) the last execution.


TradeSize-snapshot

This is a reseverd word from TS and show an snap shot of how many contracts are being exchanged in each trade.


Vol/trades-Average

Equals the quotient of the volume of the so-far session divided by the trades so far since the open.


I just plotted them in my screen, next to the price candlestick bar chart, so I really have no a clear idea of what to do with these nice tools.


For example: We are in a 30 minute rally and we also see a strong positive uptick-downtick with some TradeSize-snapshot above the Vol/trades-Average that means we are seeing some big executions following the trend.


In the contrary if the market is bullish and tradeSize strongly > Vol/trades but Uptick-DownTick is constantly negative, then maybe some heavy scalpers are taking profits and we might accompain them to the exit door or wait for a next wave.


Check this out: Oil making a bottom at 68.59 in 7 minutes, tick positively strong and trade getting heavy. paper: buy at 68.87 and sell when the tick gets negative. its 1:16pm [Guate tieme]. Next paragraph says what happened. [i have delayed data].

OILTRADING


And the result was…


now that think about the trade should have been from the short side because intraday tends to be mean reverting. But do not forget the initial hipothesys, heavy weights come out in the upper part of the crust.


the vol/trades is weakining as well as the tickpudown.


The putckdowtick is at 13… that’s enough. I think this is meareverting, not follower. Loss of 68.87-68.63= -$240.


Idea = short the oil when the minute upticdowntick is above [donchian channel ..?] and buy back when the indicator gets negative. Same say in the oppossite direction.

What about the risk mngmnt?


OILTRADING2


thni the mkt is over, bad time, the closing rush was over.